JMeter for Performance Test
# JMeter
The Apache JMeter (opens new window)™ application is open source software, a 100% pure Java application designed to load test functional behavior and measure performance.
# What You Can Do?
Originally it was designed for Web Application testing but now it supports many more things, but that does not limit for something that could be missing, because JMeter supports plugins which you can either download or build yourself to extend the limits.
- JMeter has ability to load and performance test many different applications/server/protocol types:
- Web - HTTP, HTTPS (Java, NodeJS, PHP, ASP.NET, …)
- SOAP / REST Webservices
- FTP
- Database via JDBC
- LDAP
- Message-oriented middleware (MOM) via JMS
- Mail - SMTP(S), POP3(S) and IMAP(S)
- Native commands or shell scripts
- TCP
- Java Objects
- It has full-featured IDE that allows you to record your complete test case/test plan.
- It has assertions/pre-processors/post-processors with which you can validate, do something extra before test and extract or do something after each of the sampler is executed
- Easy Continous Integration through 3rd party support of Maven, Gradle, Jenkins, TeamCity, GitLab-CI etc
- Provides a complete ready to present dynamic HTML report.
# How to Use?
# Download JMeter
Get the latest zip from Apache Jmeter Downloads (opens new window) site
# For Windows
Two ways to start the program,
- Double click
jmeter.batfrom thebinfolder - Open
cmdand navigate to your{JMeterPath}\binfolder and runjmeteras a command
# For Linux
- Run the shell file
jmeter.shfrom{JMeterPath}\binfolder
# Your first Performance Run
You will see two branches in JMeter upon starting namely Test Plan and Workbench
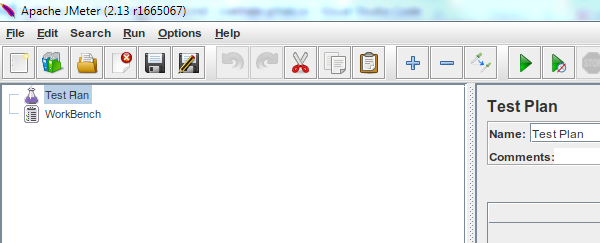
- Test Plan is the area where your actual test will reside
- Workbench is the place where you can do all your experimental and non-test related items.
- JMeter never saves workbench unless you explictly mentions to save Workbench, so everytime you start JMeter again you see an empty Workbench
Now lets start by creating your first test case.
# Test Case Scenario
- Assume you are doing a performance test of your REST services
- You will have some individual non-dependent services and some might be scenario based services
- Lets assume you have non-dependent services which can be called in any sequence and any number of times
- For our example lets assume the following workflow
- REST to create user account (HTTP POST Request)
- REST to validate login of newly created user account (HTTP POST Request)
- REST to fetch details of logged in user (HTTP GET Request)
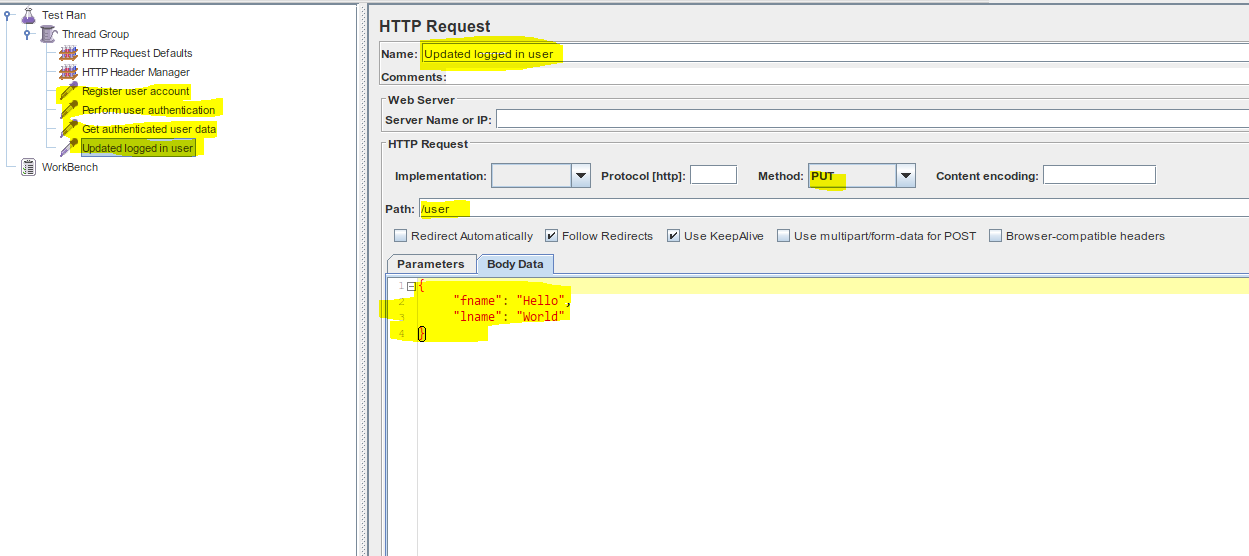
- REST to update details of logged in user (HTTP PUT Request)
# Steps for creation
Note: Right Click on Test Plan/Workbench gives you a lot of operations to do
- Firstly you need Thread Group which will contain your actual Sampler(actual executor)
Add > Threads > Thread Group

- Here you can configure the number of threads to run (this means number of users you need to simulate traffic as)
- Ramp-Up period, after how many seconds the each thread should start
- Loop-Count states how many times you need to repeat all these operations
- Assuming our webserver is fixed, we will need HTTP Request Defaults that will config the repetative HTTP details
Add > Config Elements > HTTP Request Defaults

- Add HTTP Request Sampler to simulate the HTTP request that contains our first test case request details like Path, Body, Request Method
Add > Sampler > HTTP Request
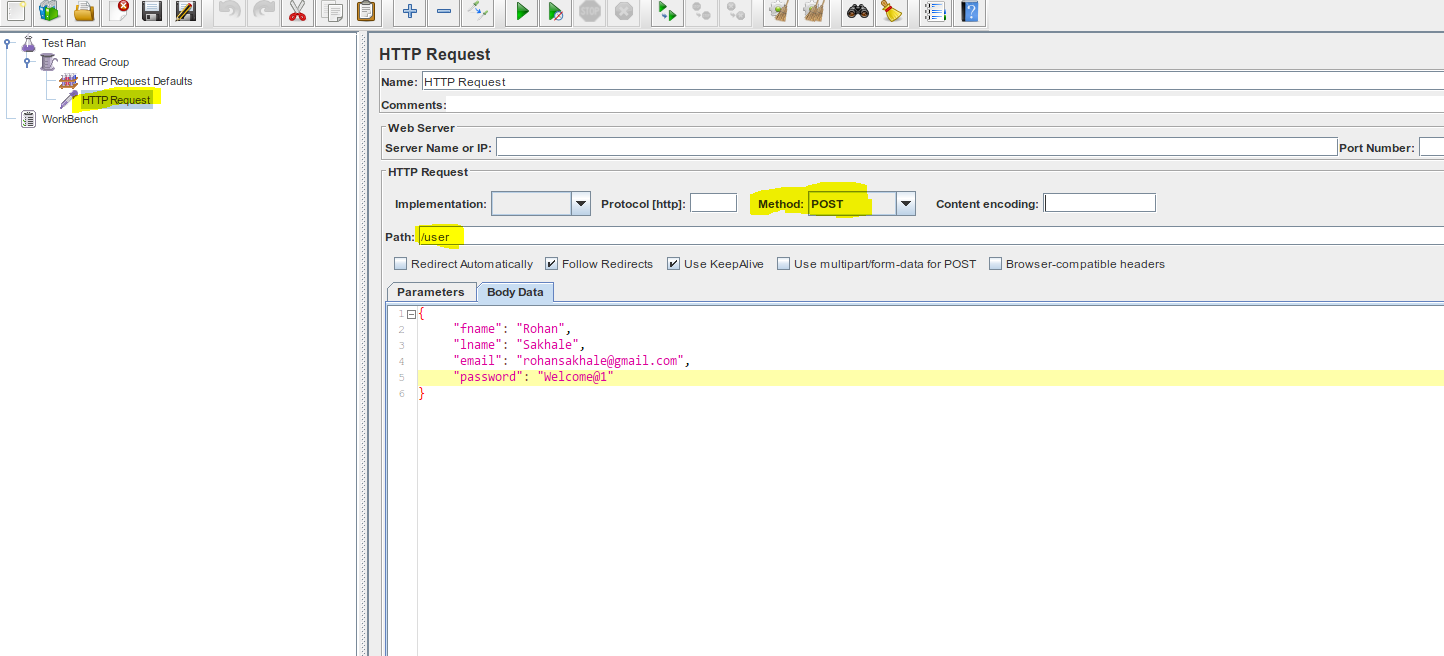
- Since this is a REST POST Request, we may need to provide additional headers to tell server content we provide is **application/json**
- Add HTTP Header Manager to provide additional request headers on Thread Group level so this becomes available for all the HTTP request underneath
Add > Config Element > HTTP Header Manager

- Similarly add three more HTTP Request Sampler for Authentication Request (POST), User details Fetch Request(GET) and Update User details(PUT), so it should look something like below
- There could be a possibility you may want to extract the response of HTTP Request to fetch values like "Access-Token" from authentication request which can be used as RequestHeader parameters
- Right click on your request which requires extraction
Add > Post Processor > Regular Expression Extractor
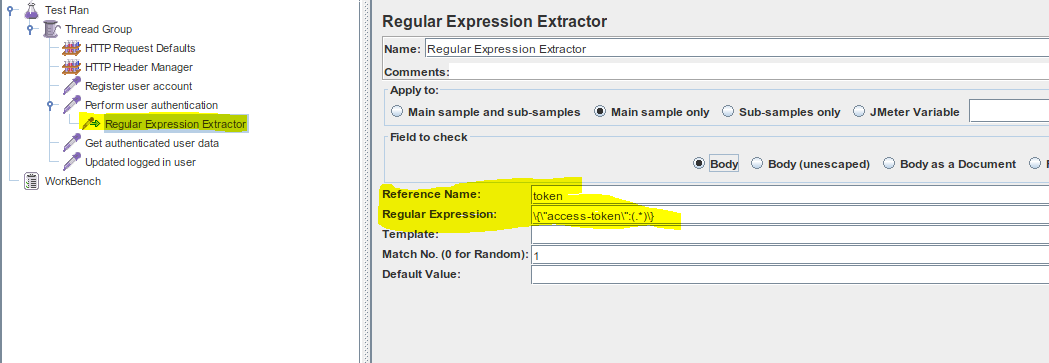
- Previously extracted value is saved in JMeter Variables which now needs to be passed as Request Header Parameer and can be used as
${token}expression anywhere in text fields of JMeter Components.- Right click on your request which requires header parameter named
token Add > Config Element > HTTP Header Manager
- Right click on your request which requires header parameter named

- Finally you will need to add a Listener, that listens to all your samplers and lets you know if it worked or failed
Add > Listeners > View Results Tree
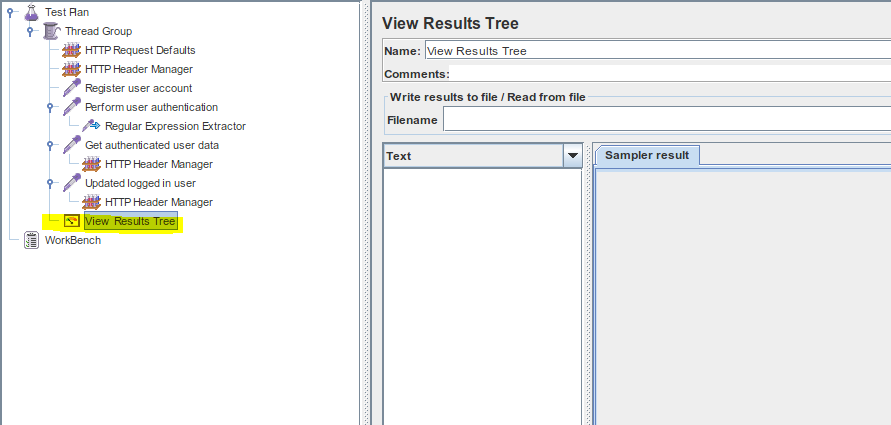
- Optionally you may need to add validation to every request to check if the response coming is appropriate, this can easily be achieved using Assertions
- Right click on HTTP Request that requires assertions
Add > Assertion > Response Assertion
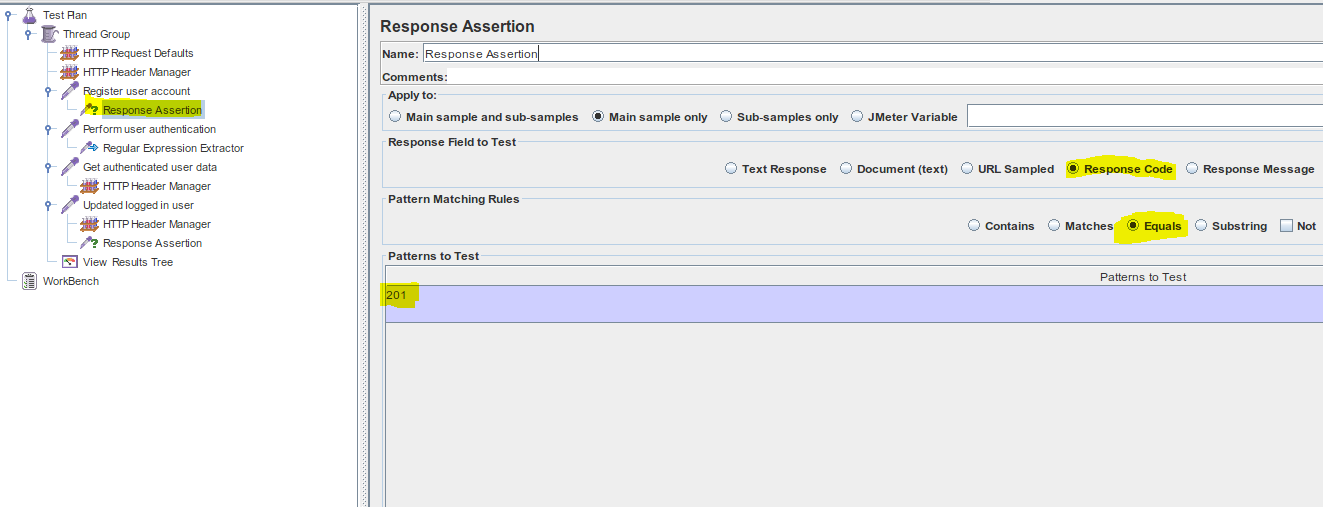
- There are many assertions available that you may add to do the right validation for each of your request
- Finally save your test case and click on Play button to start the test case for single threaded user and view your results in the listener you had added named "View Results Tree"
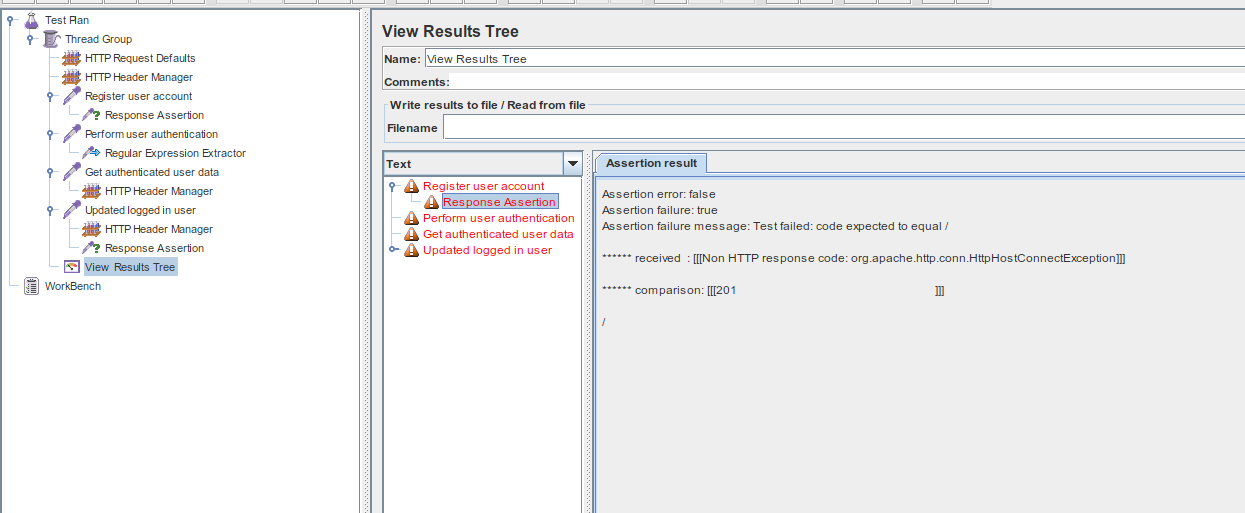
- Above shows all errors as my application server is not available
- If a request is executed perfectly, it will be shown as green
This was executed as single user by setting the thread count to 1, now you can simulate more users by simply increasing the number of threads and updating the Ramp-up time correctly.
# Conclusion
JMeter with simple user interface allows a deeper performance testing as seen above and supports many protocols. It also supports Master/Slave configuration for doing remote execution to simulate more number of threads concurrently which runs simultaneously. Also test cases build using JMeter can easily be added to your Continous Integration build chain by simply executing the saved test case in non-gui jmeter headless mode.
Happy Testing!